Chart of the Week
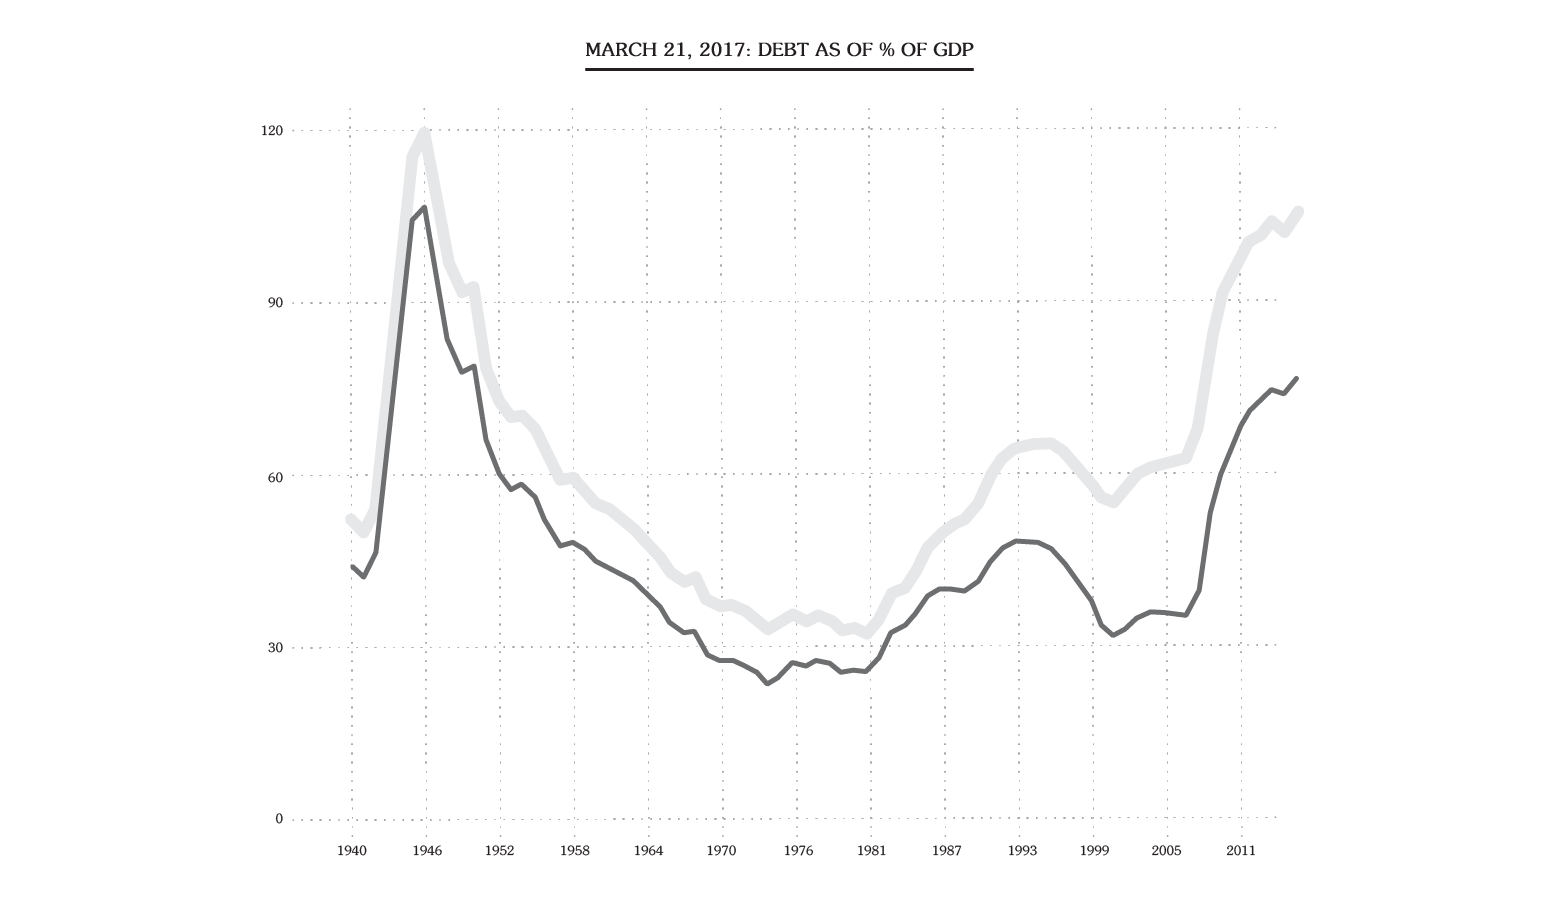
During the Boomer decades, national debt expanded rapidly and - per the CBO - is on track to exceed its World War II levels in the coming years. (It's useful to compare the chart of Boomer power with this chart to track the correlation between debt and Boomer power; the causal mechanisms are traced in the book itself.)
There are no existing plans to address the debt and over the next fifteen years, almost all Boomers will transition into retirement, leaving younger generations with the bill. That does not imply an immediate debt crisis, but it does represent a substantial, generational burden shift. As of Q3 2016, gross debt to GDP stood at 104.8% and was expected to rise faster than GDP for the forseeable future.
NB: The difference between "debt held by the public" and "intragovernmental debt" is the product of debt one part of the government owes to other parts, with substantial borrowing represented by the Social Security Trust Fund. The government also has other quasi-liabilities, like its insurance backstops, that are not reflected in this chart and may push debt much higher.
Sources: Noted in the book, Chapter 9. Government debt can be conveniently accessed via the Treasury, through the Federal Reserve's "FRED" portal, and is summarized by OMB historicals and the CBO's decadal forecastring; other sources are noted in the book in the endnotes to Chapter 9.
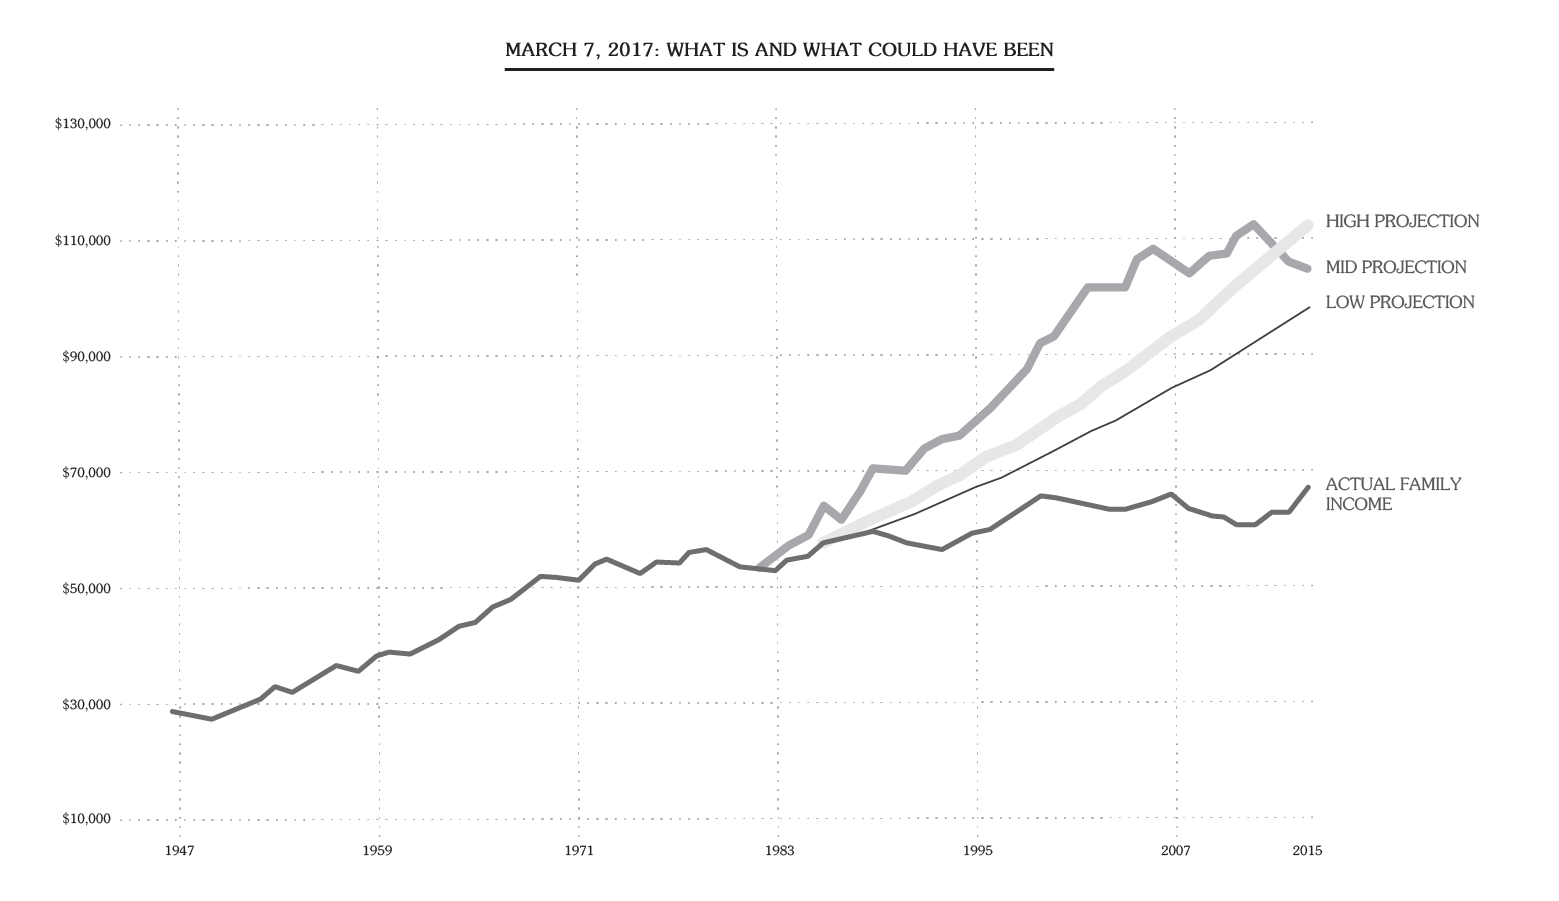
How has American family income grown under the Boomers? Not terribly well, it turns out – for the reasons set out in the book.
Moving along: this chart presents median family incomes (which have longer history than median personal incomes) as they actually grew and as they might have grown (had pre-Boomer growth and the policies that fostered it been maintained). You’d expect a modest lag between Boomer power and economic effect, and that’s more or less what happened.
There are many variables in these sorts of counterfactuals, so I’ve presented some different scenarios – high, low, and mid-case. My own mid-case analysis is somewhat more forgiving to the Boomer years than, say, that presented in the Economic Report of the President (2015), which did a similar counterfactual using different methods.
NB: Because of the complexity of these sorts of projections, the assumptions, methods, and full source list aren’t reproduced here, but they’re sitting in the endnotes to the introduction of the book. (E.g., yes, we all know that what constitutes “income” and “family” have changed over time, but this doesn’t bail the Boomers out – the endnotes have the gory details.) Finally, this chart is taken from the book and represents data available at press time. There have been updates since, though we are still waiting for FY data – but given the magnitude of the changes and length of the period, the conclusion won’t change.
Sources: See the endnotes to the book’s introduction and chapter 15, based on calculations derived from the Federal Reserve, the BEA, inflation data produced by both, and my assumptions and calculations; see also the CEA’s “The 2015 Economic Report of the President” at ch. 1, p. 39. Projections like these are always subject to interpretation and dispute, so it’s important to refer to the full (and admittedly lengthy) discussion in the book’s endnotes before leaping to any particular conclusions beyond the fact that – like the CEA – I conclude median economic growth for income units decelerated notably in the Boomer years, resulting in quite a bit of lost income.
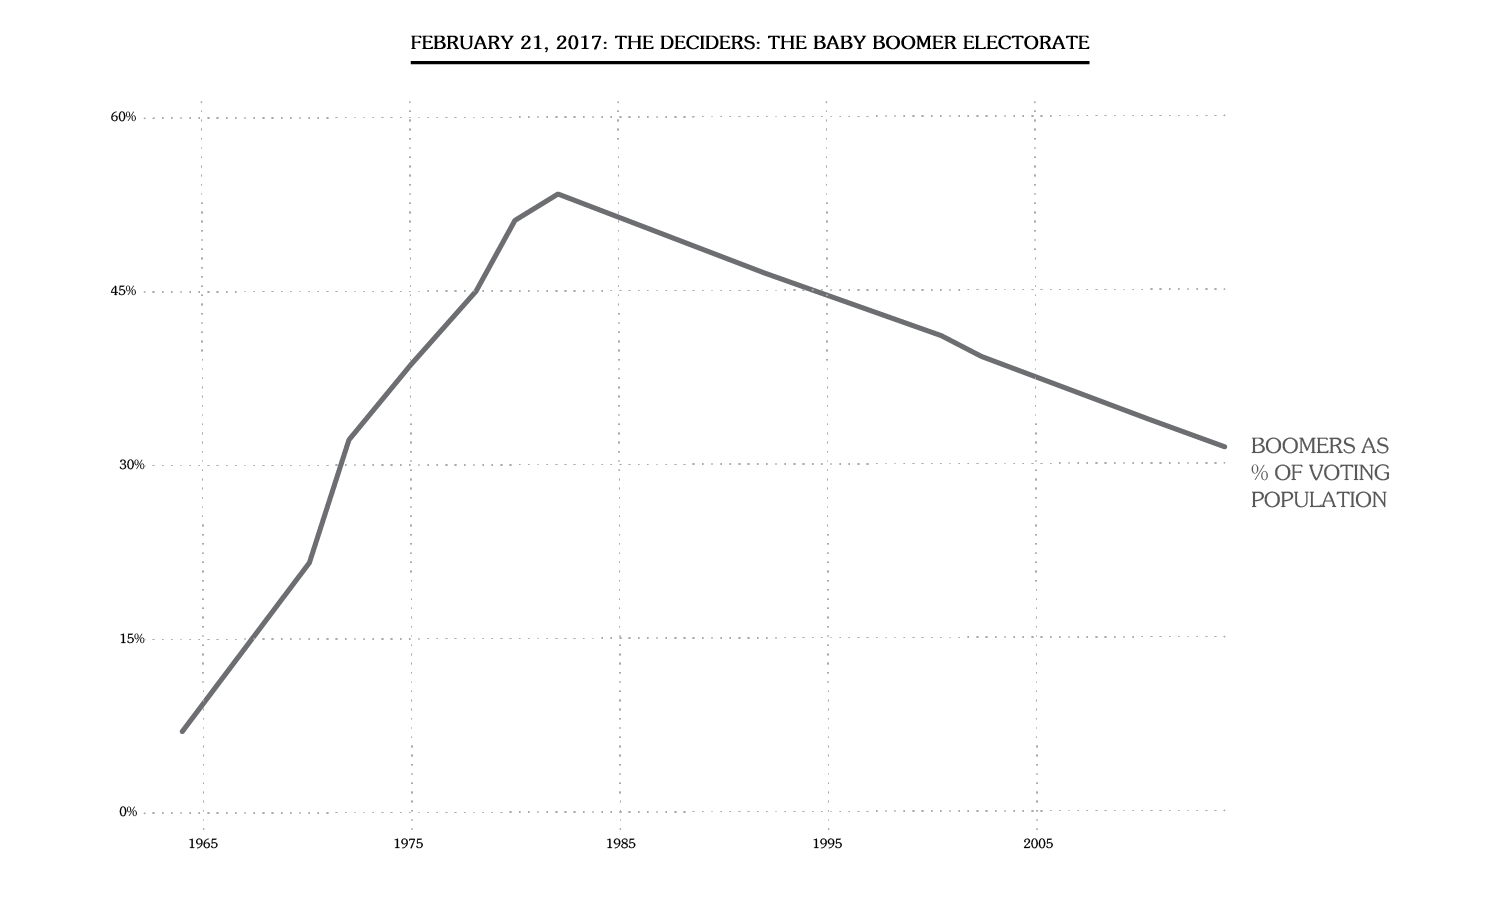
In the long decades of American decline, who has been in charge? The Boomers. While Boomers' raw votes peaked in the early 1980s, Boomer influence kept growing as the generation aged, gathered offices, made political donations, and most importantly, as their voting participation rates increased. Government remains firmly in Boomer hands, as a quick survey reveals. The generation holds 69% of the House, 81% of governorships, and of course the Oval Office (again). And they have unusual preferences - the only major age group with anything approaching enthusiasm overall for Trump and in relentless pursuit of on policies that will keep the young as unwilling guests in the hellish hotel of Boomer creation, décor by H. Bosch, management by Berlusconi.
NB: The jump in Boomer power between the late 1960s and early 1970s reflects the lowering of the federal voting age by statute and then by the 26th Amendment, a political result itself compelled by a growing need for an older establishment to cater to the Boomers.
Sources: See chapters 1, 4 and 7 of the book and the related endnotes (referencing author's calculations based on US Census reports 1940-2015 incl. intercensal estimates; CDC Live Births & Death Rates Data 1950-2008, the Statistical Abstract of the United States (various years), Vital Statistics of the United States (various years); Gallup Approval & Exit Polls (various periods); see also the book Chapter 1 for a discussion of what defines a 'Boomer.'
Publisher
Federal Reserve, St. Louis Fed Research Archives
US Census
Bureau of Economic Analysis
Bureau of Labor Statistics
Office of Management And Budget

Do Not Bend LLC/Bruce Gibney © 2017. All Rights Reserved.
Terms of Use.